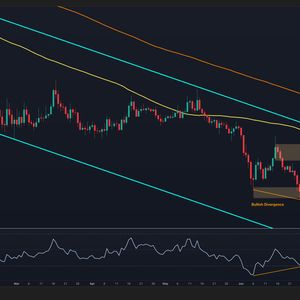
Ripple’s XRP has delivered a strong recovery from its recent lows, validating the bullish divergence that developed near support. While the broader market structure remains corrective, the latest rally has pushed the price back toward a critical technical inflection point where the next directional move could be determined. Ripple Price Analysis: The Daily Chart The daily timeframe continues to show XRP trading inside a long-term descending channel, remaining below the major moving averages and the channel’s upper boundary. Despite the broader bearish structure, the recent price action has improved considerably. The bullish RSI divergence that formed around the $1.02-$1.05 support zone has played out as expected. While the asset was making lower lows, momentum was printing higher lows, signaling weakening selling pressure. Since then, XRP has rebounded sharply and reclaimed the lower support region around $1.02-$1.06. The recovery has now carried the price toward the first major resistance zone between $1.17 and $1.24. This area previously acted as support before the latest breakdown and is now functioning as supply. The RSI has also pushed back above the midline, confirming improving momentum and strengthening the case for a continued recovery attempt. However, the broader trend remains bearish as long as the token trades beneath the descending channel resistance and the major moving averages overhead. A successful reclaim of the $1.17-$1.24 region would be the first sign that the market is attempting to build a larger reversal structure. XRP/USDT 4-Hour Chart The 4-hour chart provides a clearer view of the recent breakout. XRP spent several days consolidating inside the $1.02-$1.06 demand zone before buyers aggressively stepped in and triggered a sharp rally toward the descending trendline resistance. The move has already reclaimed the local support area and pushed price directly into the trendline that has capped lower highs since mid-June. XRP is now testing this dynamic resistance as it approaches the lower boundary of the broader $1.21-$1.29 supply zone. This creates a pivotal setup. A confirmed breakout above the descending trendline would likely open the door for a move into the upper resistance region, where sellers may attempt to regain control. Such a breakout would also confirm a short-term structural shift after weeks of lower highs and lower lows. On the other hand, failure to break through the trendline could trigger a temporary pullback toward the recently reclaimed support zone. As long as the asset remains above the $1.02-$1.06 area, the current recovery structure remains intact. For now, momentum favors the bulls in the short term, but the market is approaching a major resistance cluster where a decisive breakout is needed to confirm that the recovery is evolving into something more significant than a relief rally. The post Ripple Price Analysis: What Are XRP’s Next Targets After 8% Weekly Surge? appeared first on CryptoPotato .